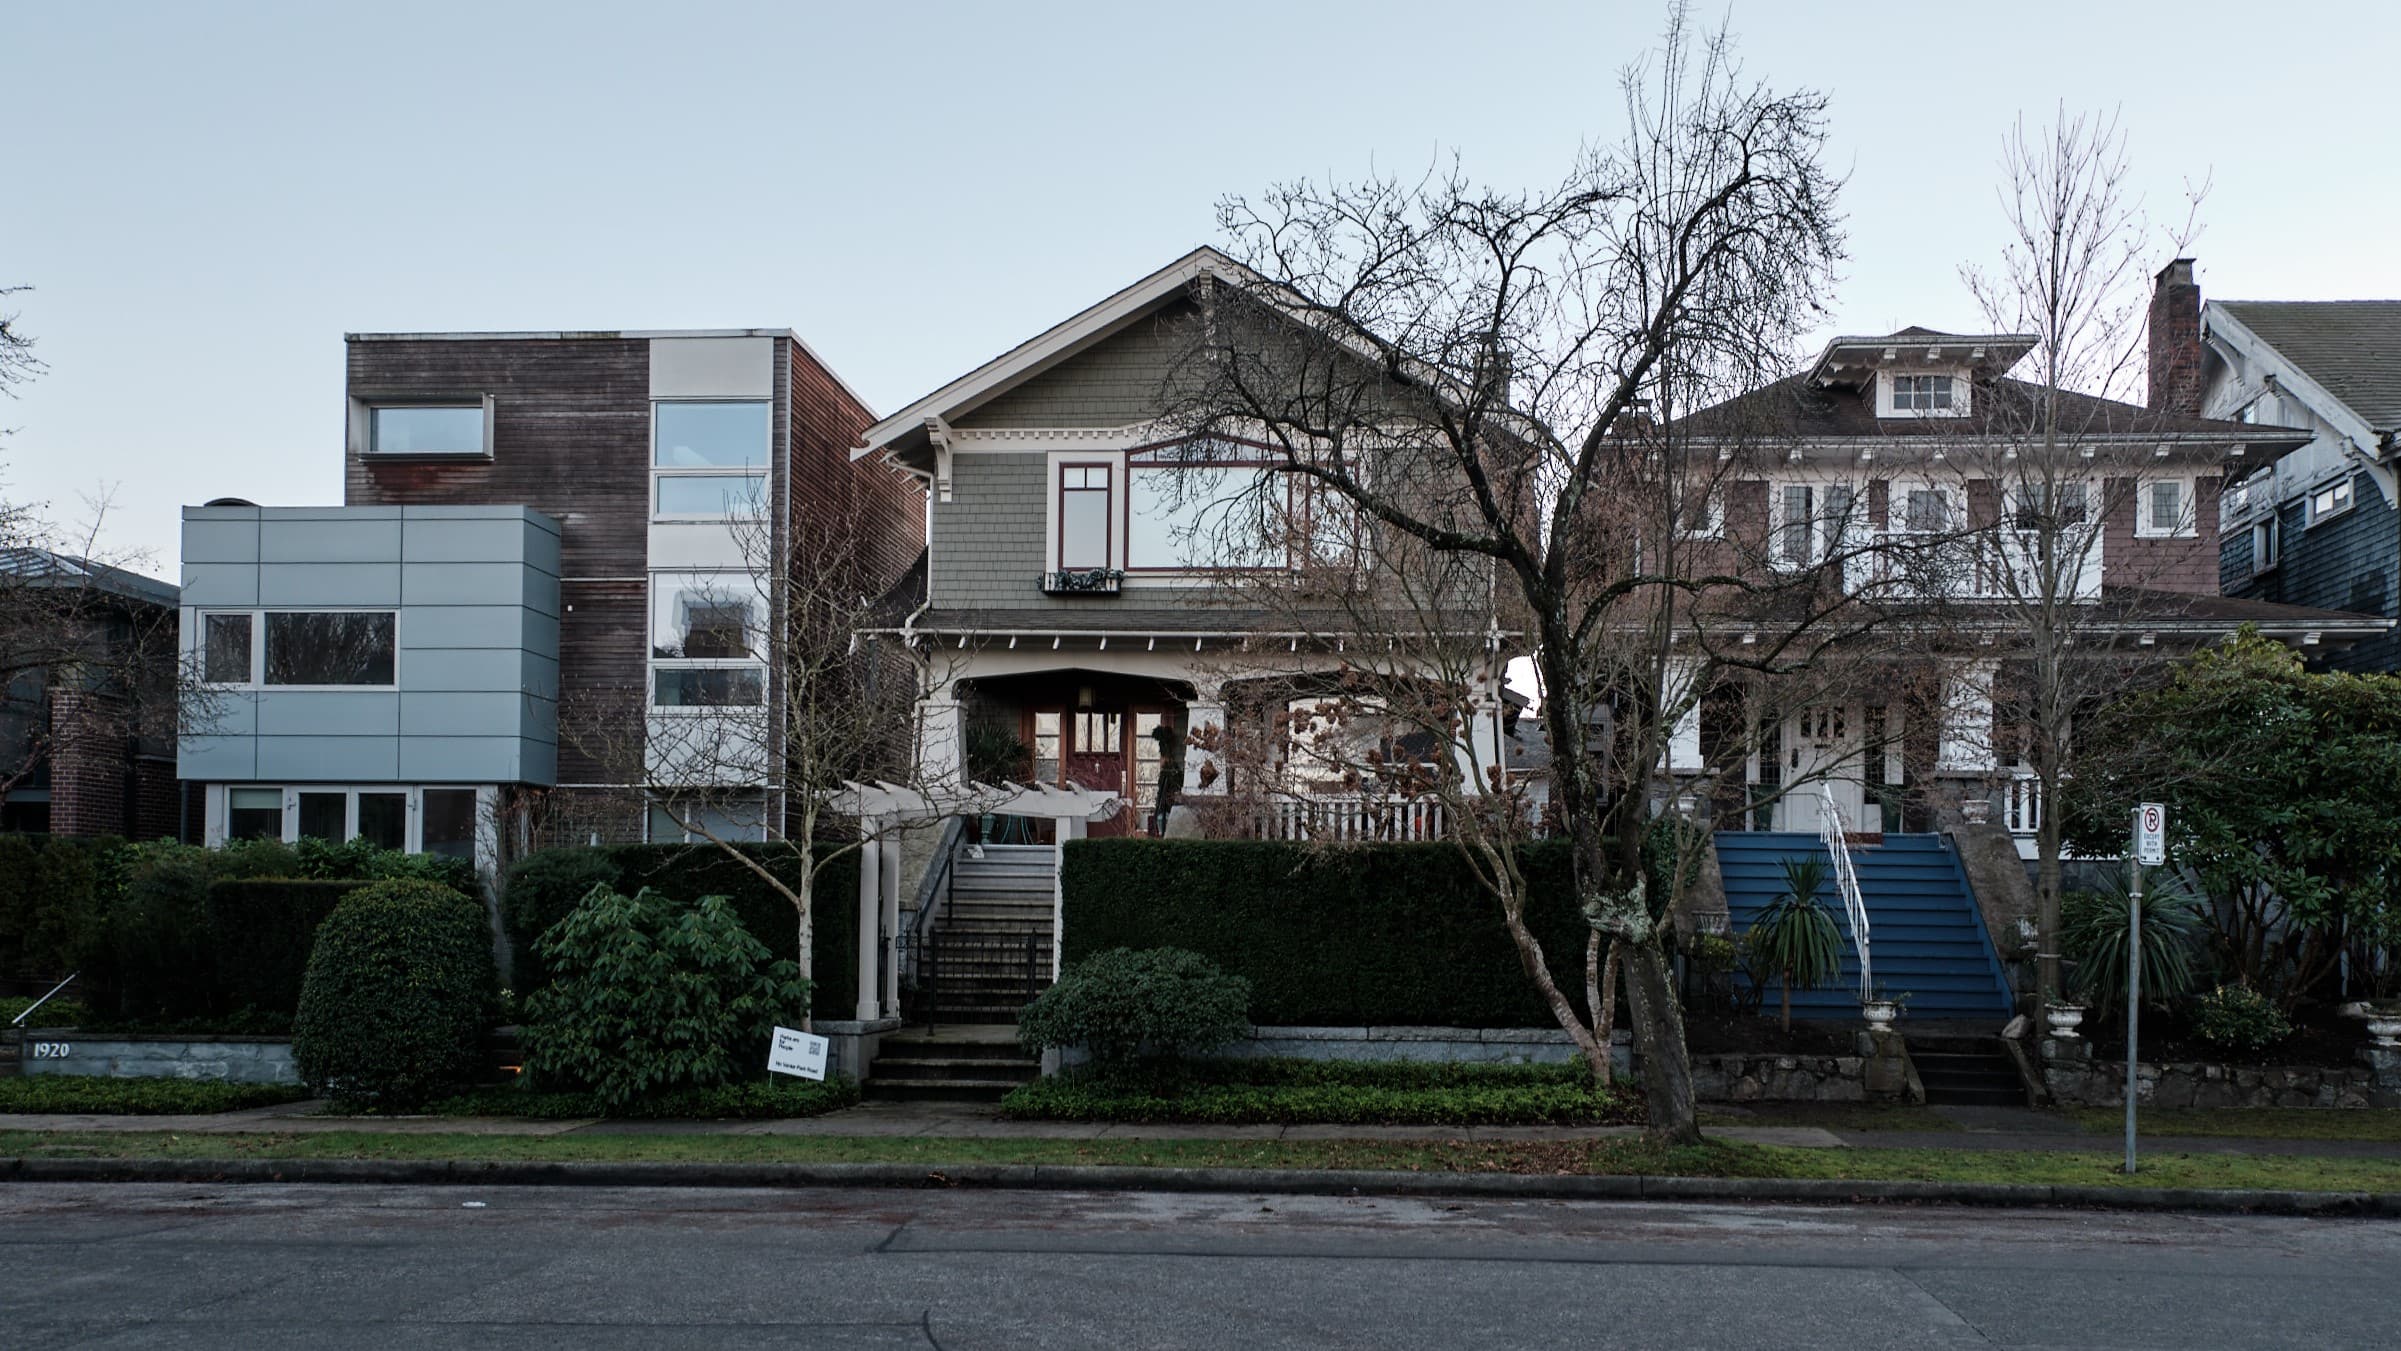
KITSILANO
Note: This representation is based in whole or in part on data generated by the Real Estate Board of Greater Vancouver which assume no responsibility for its accuracy.
MLS® HPI Price in Last 10 Years
Market History Data From 2014-2025
| YEAR | NUMBER OF SALES | HIGH | LOW | AVERAGE | MEDIAN |
| 2025 | 68 | $9,250,000 | $1,425,000 | $3,189,205 | $2,894,000 |
| 2024 | 96 | $10,350,000 | $1,590,000 | $3,144,533 | $2,931,500 |
| 2023 | 79 | $24,000,000 | $1,900,000 | $3,481,229 | $2,900,000 |
| 2022 | 97 | $22,000,000 | $1,720,000 | $3,491,177 | $2,880,000 |
| 2021 | 131 | $20,300,000 | $1,460,000 | $3,250,456 | $2,845,000 |
| 2020 | 103 | $27,000,000 | $1,430,000 | $3,255,718 | $2,585,000 |
| 2019 | 82 | $15,500,000 | $1,670,000 | $2,928,380 | $2,325,000 |
| 2018 | 85 | $8,100,000 | $1,400,000 | $2,785,055 | $2,600,000 |
| 2017 | 124 | $17,600,000 | $1,315,000 | $3,477,019 | $2,890,000 |
| 2016 | 173 | $7,000,000 | $1,335,000 | $2,932,194 | $2,750,000 |
| 2015 | 175 | $22,000,000 | $1,330,000 | $2,527,457 | $2,150,000 |
| 2014 | 151 | $10,988,000 | $930,000 | $1,996,998 | $1,750,000 |


